




Defining the Architecture of Commodity Price Cycles
Commodity markets operate on a distinct rhythm, driven by the immutable forces of supply and demand, yet complicated by financialization, geopolitics, and macroeconomic shifts. Understanding these trends requires moving beyond simple price observation to analyzing the structural architecture of market cycles. Unlike equities, which theoretically possess infinite upside, commodities are tethered to physical reality. They are harvested, mined, drilled, and consumed. This physical constraint creates predictable, albeit volatile, patterns. A commodity super-cycle typically spans 10 to 15 years, characterized by prolonged periods of price expansion followed by painful contractions. These are distinct from shorter business cycles, which may last 3 to 5 years, often aligning with broader economic expansions or recessions. The core driver is capital expenditure (CapEx). When prices are high, producers invest in new supply. However, due to the long lead times of mining and energy projects—often 5 to 10 years—this new supply hits the market just as demand may be cooling, creating a glut and triggering the next downcycle. Recognizing where a commodity sits within this temporal map is the first step in sophisticated market analysis.
The Mechanics of Mean Reversion and Marginal Cost
The gravitational pull in commodity pricing is mean reversion towards the marginal cost of production. Prices cannot stay below the cost of production for extended periods without causing supply destruction. When prices fall below the 90th percentile of the cost curve, high-cost producers are forced to shut down operations. This supply reduction eventually stabilizes prices. Conversely, when prices soar above the marginal cost, it signals the market to bring on new supply. However, the “marginal cost” is not static. It shifts based on energy input costs, labor availability, and regulatory burdens. For instance, the marginal cost of copper mining has risen steadily due to declining ore grades and stricter environmental regulations. Analysts must track the cost curve to identify price floors. If a commodity is trading significantly below its incentive price—the price required to justify new investment—a supply crunch is inevitable in the future. This lag between price signals and supply response is the primary source of volatility and the mechanism that generates cyclical trends.
Macroeconomic Drivers: The Dollar and Interest Rates
Commodities are priced globally, predominantly in US dollars, creating an intricate inverse correlation with the currency’s strength. A stronger dollar makes commodities more expensive for foreign buyers, suppressing demand and lowering prices. Conversely, a weak dollar acts as a tailwind for commodity prices. Beyond currency, interest rates play a pivotal role. Commodities are non-yielding assets; they produce no dividends or interest. Therefore, when real interest rates rise, the opportunity cost of holding commodities increases, often leading to capital outflows from the sector. Furthermore, high interest rates increase the cost of carrying inventory and financing production, which can force liquidation. Inflation expectations also dictate trends. Commodities are often viewed as a hedge against inflation. When inflation expectations rise, capital flows into real assets. Understanding the Federal Reserve’s monetary policy stance is therefore non-negotiable for a commodity trader; the liquidity cycle often precedes the commodity cycle.
The Role of Backwardation and Contango in Trend Identification
The futures curve—the difference between spot prices and futures prices—offers critical insights into the physical market’s tightness. Backwardation occurs when the spot price is higher than the futures price, signaling a supply deficit. The market pays a premium for immediate delivery, incentivizing inventory drawdowns. Backwardation is a hallmark of bull markets and indicates that demand is outstripping supply in real-time. Contango, the opposite, occurs when futures prices are higher than the spot price. This structure signals ample supply and high storage costs. In a contango market, investors holding long positions face “negative roll yield,” as they must pay to roll contracts forward. Persistent contango is a strong bearish signal, indicating that storage is full and demand is weak. Analyzing the shape of the curve—whether steeply backwardated or in deep contango—provides a real-time diagnostic tool for determining the phase of the price cycle.
Inventory Levels: The Physical Truth Serum
While sentiment and momentum drive short-term prices, inventory levels are the ultimate arbiter of truth in commodity markets. The “Days of Consumption” metric—total inventory divided by daily usage—is a reliable indicator of price direction. Low inventory levels leave the market vulnerable to supply shocks, creating asymmetric upside risk. High inventory levels act as a buffer, dampening price spikes. The market cycle often turns when inventory builds or depletes contrary to consensus expectations. For example, if oil inventories are building despite OPEC production cuts, it suggests demand destruction is deeper than anticipated. Traders watch weekly inventory reports closely because they reveal the physical reality of the supply-demand balance, stripping away speculative noise. The trend of inventory changes is often more important than the absolute number, as it indicates the velocity of the market’s balance or imbalance.
Geopolitics and Supply Chain Fragility
Commodity markets are uniquely susceptible to geopolitical shocks. Unlike services, commodities are often sourced from specific geographic regions with distinct political risks. A disruption in a major producing region—whether due to conflict, sanctions, or natural disasters—can trigger immediate price spikes. The trend toward “friendshoring” and supply chain diversification is altering the geopolitical premium embedded in commodity prices. The transition to green energy has introduced new dependencies on critical minerals like lithium, cobalt, and rare earths. These markets are prone to extreme volatility due to their thin liquidity and concentrated supply chains. Understanding the geopolitical landscape is not merely about predicting conflict; it is about analyzing trade flows, tariffs, and sanctions. A trade war can rewire global supply chains, creating regional price dislocations—such as cheap gas in the US and expensive gas in Europe—that persist for years.
Behavioral Finance and the Speculative Pendulum
Commodity markets are not purely rational; they are subject to the pendulum of fear and greed. The trend-following nature of Commodity Trading Advisors (CTAs) often amplifies price moves. Trend followers buy when prices rise and sell when they fall, adding momentum to existing cycles. When a fundamental narrative becomes consensus—such as the “super-cycle” narrative in mining—it often marks the peak of the cycle, as all available capital has already been deployed. Conversely, when a sector is abandoned by investors and capital expenditure is slashed, it sets the stage for the next bull market. The “resource curse” of capital discipline often leads to underinvestment during downturns, creating the seeds of the next shortage. Analyzing positioning data—such as the Commitment of Traders (COT) report—can reveal when the market is overcrowded, signaling a potential reversal.
Technological Disruption and Substitution
Long-term trends are also shaped by technological evolution. High prices incentivize innovation and substitution. During the oil crises of the 1970s, high prices spurred energy efficiency and the development of alternative energy sources. Similarly, high copper prices incentivize the use of aluminum or plastics in wiring and plumbing. The current trend of decarbonization is a structural shift that will redefine demand for decades. However, one must also consider “demand destruction.” If prices rise too high, consumers eventually change behavior or technologies. The elasticity of demand varies by commodity; it is low for food and energy but higher for industrial metals. Understanding the threshold where demand destruction kicks in is crucial for identifying the top of a price cycle.
The Intersection of ESG and Capital Allocation
Environmental, Social, and Governance (ESG) criteria have become a significant determinant of supply trends. Regulatory hurdles and shareholder activism have made it increasingly difficult to finance new fossil fuel projects or mines. This constraint on capital flows acts as a structural floor for prices, as supply cannot respond as elastically as it did in previous cycles. The social license to operate is now a critical factor in project development timelines. This “green inflation” implies that the cost of extraction will continue to rise, supporting higher price floors. Investors must factor in the cost of carbon and the risk of stranded assets when analyzing long-term trends. The cycle is no longer just about geology and economics; it is about the politics of sustainability.
Charting the Course: Technical Analysis as a Guide
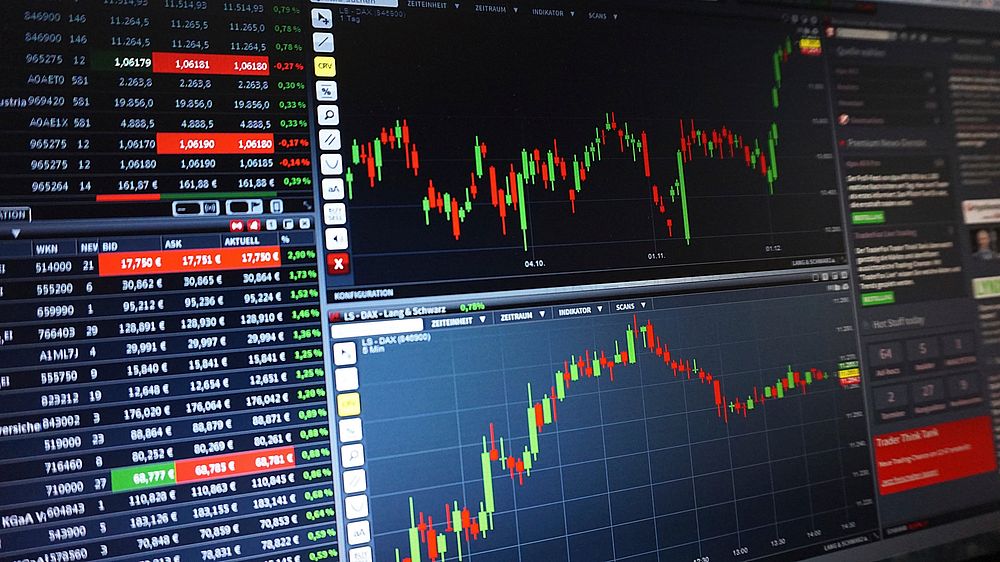
While fundamentals dictate the eventual destination, technical analysis helps navigate the path. Price action often discounts fundamental information before it becomes public knowledge. Chart patterns—such as head and shoulders, triangles, and flags—can identify trend reversals and continuations. Moving averages smooth out the noise to identify the underlying trend. Volume analysis confirms the strength of a breakout or breakdown. In commodity markets, support and resistance levels often align with psychological price points or the marginal cost of production. Using technical analysis to time entries and exits, while relying on fundamentals to determine the direction, creates a robust framework. The trend is your friend, but the trend is ultimately subject to the physical reality of the commodity cycle.

