





1. Mastering the Axis Architecture: Price, Time, and Scale
The foundation of professional chart analysis lies in understanding the coordinate system. Unlike static diagrams, commodity charts are dynamic representations of market psychology. Begin by verifying the vertical axis (y-axis), which represents price. Professionals never assume the scale; they check if the chart uses a linear or logarithmic scale. Linear scales plot price changes in absolute terms, which is standard for short-term trading. However, logarithmic (log) scales are essential for long-term analysis of commodities like crude oil or gold, as they represent percentage moves accurately, preventing the visual distortion of massive historical price swings. The horizontal axis (x-axis) represents time, but the intervals are not always equal. A daily chart compresses weekends and holidays, meaning the distance between Friday and Monday is the same as Tuesday and Wednesday. For futures contracts, pay strict attention to the contract rollover dates; a continuous contract chart (where the front month is spliced with the next month) can create artificial price gaps. Professionals use “back-adjusted” continuous contracts to smooth these transitions and maintain technical integrity.
2. Decoding the OHLC Bar and Candlestick Anatomy
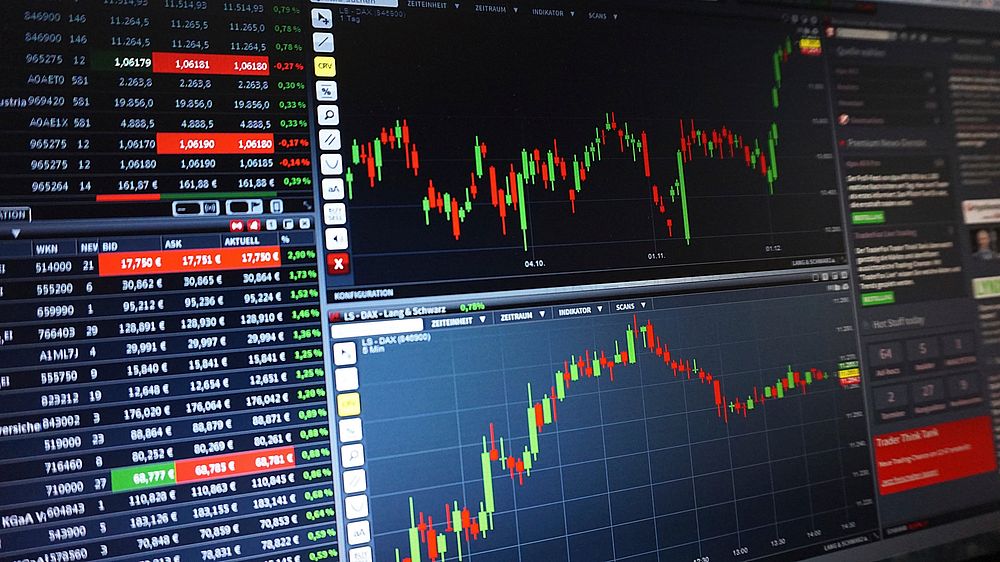
While line charts offer a clean look at closing prices, professionals rely on Open-High-Low-Close (OHLC) bars and candlesticks for granular data. Each candlestick reveals the battle between buyers and sellers within a specific timeframe. The “body” represents the range between the opening and closing prices. A filled or red body indicates the close was lower than the open (bearish), while a hollow or green body indicates a higher close (bullish). The “wicks” or shadows show the extremes—the highest and lowest prices reached during the session. A long upper wick suggests buyers pushed prices high, but sellers rejected those levels, forcing a close near the bottom. In commodity markets, which are heavily influenced by supply shocks, these wicks are critical. A long lower wick on a daily chart often signals that commercial hedgers stepped in to buy the dip, providing a floor for the price. Recognizing these patterns in real-time requires analyzing the relationship between the body size and the wick length.
3. Volume: The Engine of Commodity Price Action
Price is the vehicle, but volume is the fuel. In commodity futures, volume represents the total number of contracts traded during the period. A price move accompanied by high volume carries significantly more weight than a move on low volume. Professionals look for volume confirmation on breakouts. If the price of soybeans breaks through a resistance level but volume is declining, the breakout is likely a “fakeout” driven by a lack of selling pressure rather than genuine buying interest. Conversely, a price drop on massive volume indicates a liquidation event or a fundamental shift in supply. Open Interest (OI) is the second half of the volume equation. While volume counts the trades that occurred today, Open Interest counts the total number of outstanding contracts. Rising Open Interest alongside rising prices confirms a strong uptrend, as new money is entering the market. If prices rise but Open Interest falls, the rally is likely driven by short-covering (buyers closing losing positions) rather than new bulls, signaling a potential reversal.
4. Identifying Support and Resistance Dynamics
Commodity charts are not random noise; they are maps of historical supply and demand. Support and resistance levels are the specific price points where the market has previously reversed direction. Professionals do not just draw lines at obvious highs and lows; they look for “clusters” of price action. A resistance level is more robust if it aligns with a previous swing high, a Fibonacci retracement level, and a psychological round number (e.g., $70 per barrel for oil). When analyzing commodities, pay attention to how price reacts at these levels. A “test” of support where price bounces immediately with strong volume indicates that the bulls are defending the level. However, if price lingers at support and volume is low, the level is weak and likely to break. Professionals also watch for “role reversal,” where a broken resistance level becomes new support, or vice versa. This flip is a high-probability trading setup.
5. Trend Analysis: Moving Averages and Market Structure
“The trend is your friend” is a cliché for a reason. Commodity markets are prone to long, sustained trends due to supply cycles. The most effective way to visualize this is through moving averages (MA). The 50-day and 200-day MAs are the industry standards. The 200-day MA acts as the long-term trend filter. When the price is above the 200-day MA, the market is in a bull regime; below it, a bear regime. The 50-day MA is used for intermediate trends. A “Golden Cross” (50-day crossing above 200-day) is a powerful bullish signal in commodities like copper or wheat. However, moving averages are lagging indicators. To read them like a pro, use them as dynamic support or resistance. In a strong uptrend, the price will often pull back to the 20-day or 50-day MA before resuming. Furthermore, analyze market structure: an uptrend is defined by higher highs and higher lows. When this pattern breaks—specifically when price creates a lower low—the trend has likely shifted.
6. Chart Patterns: Accumulation, Distribution, and Continuation
Beyond simple lines, professionals read geometric patterns that represent human psychology. Continuation patterns, such as Bull Flags and Pennants, indicate a pause in a strong trend before the next leg up. These are typically short-term consolidations after a sharp price move. Reversal patterns are more critical for risk management. The Head and Shoulders pattern is a classic distribution signal, indicating a top is forming. In commodity markets, “Accumulation” patterns (like a Wyckoff Accumulation range) occur at the bottom when commercial hedgers quietly build positions. A “Cup and Handle” pattern is common in grain markets, suggesting a bullish continuation. When identifying these patterns, the “breakout” is the key. A pattern is not valid until the price closes decisively outside the pattern’s boundaries. Professionals wait for a “retest” of the breakout point before entering, ensuring the move is genuine.
7. Oscillators and Momentum Divergence
While trend analysis tells you the direction, momentum oscillators tell you the strength. The Relative Strength Index (RSI) and Moving Average Convergence Divergence (MACD) are the standard tools. RSI ranges from 0 to 100. Generally, an RSI above 70 indicates an overbought condition, and below 30 indicates oversold. However, in commodity markets, an RSI above 70 in a strong trend can stay there for weeks. The professional use of RSI is to look for “divergence.” If the price of crude oil makes a higher high, but the RSI makes a lower high, it indicates that the buying momentum is fading, warning of a potential reversal. Similarly, the MACD histogram visualizes the difference between two moving averages. A shrinking histogram during a trend suggests the trend is losing steam. These oscillators are most effective when used to confirm a signal from price action, not as standalone entry triggers.
8. Fundamental Context in a Technical Framework
Technical charts are the “footprint” of fundamentals. A professional never reads a chart in a vacuum. If you are looking at a live cattle chart, you must know the USDA cattle-on-feed report dates. If you are trading natural gas, you must monitor weather forecasts and storage reports. A sudden spike in price on a chart is usually a reaction to a fundamental event (e.g., a freeze in Texas, a geopolitical conflict affecting crude oil). Professionals look for “event gaps” on the chart. If a price gaps up on a fundamental report and holds, the chart is confirming the fundamental shift. If it gaps up and immediately fills the gap, the market is telling you the news was already priced in. Integrating the economic calendar with your charts allows you to anticipate volatility rather than being surprised by it. High-impact data releases often occur during specific trading hours, leading to “witching hours” where volatility spikes.
9. Multi-Timeframe Analysis: The Zoom Lens
Retail traders often make the mistake of analyzing a single timeframe. A professional uses a top-down approach. Begin with the monthly or weekly chart to determine the long-term market context. Is the commodity in a secular bull market or a bear market? Then, drop to the daily chart to identify the medium-term trend and key levels. Finally, use the 60-minute or 15-minute chart to time the entry. This alignment ensures you are not trading against the larger money flow. For example, if the weekly chart shows a strong resistance level just above current prices, a short-term bullish setup on the hourly chart should be disregarded. The principle is “trade the timeframe, but respect the bigger picture.” This multi-timeframe confluence is what separates high-probability setups from gambling.
10. Execution: Stop Loss Placement and Risk Quantification
The final step in reading a chart like a pro is determining where you are wrong. Technical analysis is not about being right; it is about managing risk. Your chart structure dictates your stop-loss placement. If you are buying a breakout, the stop loss should go below the broken resistance level or the low of the breakout candle. If you are trading a trend pullback, the stop goes below the nearest swing low or moving average. Never set a stop loss at an arbitrary round number; place it where the chart structure invalidates the trade idea. For commodities, factor in the “tick size” and volatility. A stop loss that is too tight will result in being stopped out by normal market noise. Professionals look for a minimum 1:3 risk-to-reward ratio. If the chart does not offer a clear path to a target that is three times the risk, the trade is not worth taking, regardless of how good the pattern looks.
11. The Role of Seasonality and Spreads
Commodity charts possess a unique dimension: seasonality. Agricultural commodities (corn, wheat, soybeans) have distinct planting and harvest cycles that create predictable patterns on the chart. For instance, corn prices often peak in early summer due to weather premium and decline during harvest. Professionals overlay seasonal charts (average price movements over the last 10-15 years) onto the current chart to see if the current price action is aligning with historical norms. Furthermore, professional analysis involves looking at spreads—the price difference between two contract months (e.g., December vs. July corn). The shape of the futures curve (Contango vs. Backwardation) is a critical chart in itself. If the front month is trading significantly higher than the back month (Backwardation), it signals tight immediate supply. Reading these spreads provides a deeper understanding of the physical market than the outright price chart alone.
12. Sentiment and Positioning Charts
To truly read charts like a pro, you must look at the “Commitment of Traders” (COT) report. This data, released weekly, shows the positioning of Commercials (producers/hedgers), Non-Commercials (large speculators/funds), and Small Speculators. When reading a price chart, cross-reference it with a COT chart. If the price is making new highs, but the COT chart shows Commercials are aggressively selling (hedging) while Small Speculators are buying, the market is in a dangerous state. Professionals look for extreme readings where the “smart money” (Commercials) is heavily positioned on one side. These are often contrarian indicators. A price chart that looks bullish technically can be a trap if the positioning data suggests the crowd is overwhelmingly long and the hedgers are ready to sell. Combining price action with positioning data provides a complete picture of market pressure.

