




Natural Gas Trading: A Beginner’s Guide to Volatility
Natural gas is one of the most volatile commodities traded in global markets, and understanding why it moves is the first step toward trading it intelligently. Unlike crude oil, which can be stored and shipped globally with relative ease, natural gas is bulky, expensive to transport, and heavily dependent on regional infrastructure. These physical constraints create sharp price swings that can exceed 10% in a single session. For beginners, volatility is both the allure and the risk. This guide breaks down the mechanics of natural gas trading, the forces that drive its volatility, the instruments used to trade it, and the risk management principles that separate disciplined traders from casualties.
What Makes Natural Gas a Unique Commodity
Natural gas is a colorless, odorless fossil fuel composed primarily of methane. It is used for electricity generation, home heating, industrial processes, and increasingly for liquefied natural gas (LNG) exports. In the United States, the benchmark contract is Henry Hub Natural Gas futures, traded on the New York Mercantile Exchange (NYMEX) under the ticker NG. In Europe, the Dutch TTF (Title Transfer Facility) serves as the primary benchmark, while Asia relies on JKM (Japan Korea Marker) pricing. Each market has its own supply-demand dynamics, but they are increasingly linked through LNG trade.
The physical nature of natural gas explains much of its volatility. It is difficult to store, requiring underground caverns, depleted reservoirs, or salt domes. Pipeline capacity is fixed in the short term, meaning a disruption in one region cannot be quickly offset by supply from another. Weather affects both supply and demand simultaneously. These factors create a market where prices can gap overnight and where intraday ranges of 5–8% are routine rather than exceptional.
The Core Drivers of Natural Gas Volatility
Weather is the single largest driver of natural gas prices, particularly in the United States. Roughly half of U.S. households use natural gas for heating, and natural gas fuels about 40% of electricity generation. A colder-than-normal winter increases heating demand and can strain pipeline capacity. A hotter-than-normal summer increases air conditioning use, which raises gas-fired power generation. Traders monitor heating degree days (HDD) and cooling degree days (CDD) forecasts from agencies like the National Oceanic and Atmospheric Administration (NOAA). A shift of just a few degrees in a two-week forecast can move the front-month futures contract by several percentage points.
Supply-side factors are equally important. U.S. natural gas production has surged over the past fifteen years due to shale drilling in the Marcellus, Permian, and Haynesville basins. When producers shut in wells due to low prices, supply tightens quickly. Conversely, associated gas produced alongside oil in the Permian can flood the market even when gas prices are weak, because producers are targeting crude. Storage levels, reported weekly by the Energy Information Administration (EIA) every Thursday, provide the market’s most closely watched data point. A storage build or draw that deviates from consensus expectations by even 20 billion cubic feet (Bcf) can trigger outsized price reactions.
Infrastructure constraints amplify volatility. Pipeline maintenance, compressor station failures, and LNG export terminal outages can trap gas in one region while leaving another short. The Freeport LNG terminal explosion in June 2022 is a case study: the outage removed roughly 2 Bcf per day of demand, crashing U.S. prices even as European prices soared. Export capacity is now a major demand variable, and any threat to LNG flows—whether from hurricanes, labor strikes, or geopolitical tension—moves prices.
Financial flows and positioning also matter. Natural gas futures are heavily traded by hedge funds and commodity trading advisors (CTAs). When positioning becomes crowded—either long or short—a small fundamental surprise can force a wave of liquidations, creating self-reinforcing price moves. The Commitment of Traders (COT) report, published weekly by the Commodity Futures Trading Commission (CFTC), reveals speculative positioning and is a useful tool for gauging sentiment extremes.
How to Trade Natural Gas: Instruments and Markets
Beginners should understand the menu of instruments before committing capital. Futures contracts are the primary vehicle. The NYMEX Henry Hub contract represents 10,000 million British thermal units (MMBtu) and settles physically at Henry Hub, Louisiana. Contract months run twelve years out, but liquidity concentrates in the front two or three months. The front-month contract expires three business days before the first day of the delivery month, and traders must roll positions to avoid physical delivery. Margin requirements are set by exchanges and brokers, and because of volatility, margins on natural gas futures are higher relative to notional value than on many other commodities.
Options on natural gas futures offer defined risk. A call gives the right to buy futures at a strike price; a put gives the right to sell. Implied volatility on natural gas options is frequently above 60% annualized and can spike above 100% during weather events or supply shocks. Beginners should note that buying options during high implied volatility is expensive, while selling options carries unlimited or substantial risk. Spread trading—such as the calendar spread between March and April contracts—is popular among more experienced traders because it isolates specific supply-demand dynamics (winter versus shoulder season) with lower margin and reduced directional risk.
Exchange-traded funds (ETFs) and exchange-traded notes (ETNs) provide equity-market access. The United States Natural Gas Fund (UNG) is the most well-known, but it holds futures and suffers from roll costs and contango decay, making it unsuitable for long-term holding. Leveraged and inverse products magnify both gains and losses and reset daily, which erodes returns in choppy markets. For beginners, these products are best treated as short-term trading tools, not investment vehicles.
Contracts for difference (CFDs) and spread betting are available through some brokers, particularly in Europe and the UK. These instruments allow leveraged exposure without futures accounts but carry counterparty risk and financing costs. Retail forex-style brokers may offer natural gas CFDs with tight spreads but wide overnight financing charges. Beginners should verify regulatory status and understand how the broker derives its price from the underlying futures market.
Physical trading and storage deals are beyond the scope of most beginners, but understanding that physical players exist helps explain market behavior. Utilities hedge winter demand by buying futures or options. Producers hedge future output by selling futures. Storage operators profit from seasonal spreads by buying in summer and selling in winter. These commercial flows provide liquidity but also create predictable patterns—such as the “widow maker” trade, the February-March spread that has historically blown up when traders misjudge late-winter weather.
Reading the Market: Key Data Releases and Indicators
Successful natural gas trading requires a data calendar. The EIA Weekly Natural Gas Storage Report, released Thursdays at 10:30 a.m. Eastern, is the most important recurring event. It reports working gas in storage for the lower 48 states, compared with the five-year average and the prior year. A surprise build (bearish) or draw (bullish) relative to analyst estimates typically moves the front-month contract by 2–5% within minutes. Traders should note that the report reflects data from the prior week, so it is backward-looking, but it still sets the tone for near-term sentiment.
The EIA also publishes the Short-Term Energy Outlook monthly and the Annual Energy Outlook, both of which inform longer-term views. NOAA releases six-to-ten-day and eight-to-fourteen-day weather forecasts daily, and traders watch the Global Forecast System (GFS) and European Centre for Medium-Range Weather Forecasts (ECMWF) models for discrepancies. When models disagree, volatility increases because the market cannot settle on a demand expectation.
Baker Hughes publishes the weekly rig count on Fridays. While rig counts lag price signals by months, they indicate future supply trends. The EIA’s monthly drilling productivity report estimates new well production per rig, which matters for supply growth. LNG export data, pipeline flow data from providers like Genscape and Platts, and maintenance notices from major pipelines all feed into the daily information flow. Beginners should start with the storage report, weather forecasts, and LNG export news, then expand as their understanding deepens.
Volatility Mechanics: Contango, Backwardation, and the Roll
Natural gas futures curves are rarely flat. When the front-month price is lower than later months, the market is in contango—typical in shoulder seasons when demand is low and storage is filling. When the front-month price is higher than later months, the market is in backwardation—typical in winter when immediate supply is scarce. These shapes reflect storage costs, convenience yield, and expectations about future supply and demand.
The roll matters for anyone holding futures or futures-based ETFs. As the front-month contract approaches expiry, traders must sell it and buy the next month. In contango, rolling costs money because the next month is more expensive. In backwardation, rolling generates a positive return. UNG and similar funds roll monthly, and their performance can diverge significantly from spot prices over time. Beginners should calculate the roll yield before holding any futures-based product for more than a few weeks.
Implied volatility, derived from options prices, measures the market’s expectation of future price swings. When implied volatility is high, options are expensive; when low, options are cheap. Historical volatility measures realized price movement. Comparing the two helps traders assess whether options are overpriced or underpriced. During calm summer periods, implied volatility can fall below 40%; during winter cold snaps or hurricane threats, it can exceed 100%. Selling options during low-volatility periods and buying during high-volatility periods is a common strategy, but it requires discipline because volatility can remain elevated longer than a trader can remain solvent.
Risk Management: The Non-Negotiable Foundation
Natural gas trading destroys accounts that ignore risk management. The commodity’s volatility means position sizing must be conservative. A common rule among professionals is to risk no more than 1–2% of account equity on any single trade. Because natural gas can move 5% in a day and 15% in a week, a position that seems small can quickly become large in risk terms. Beginners should calculate the dollar value of a one-point move in their position and ensure that an adverse move of several points does not threaten their account.
Stop-loss orders are essential but not foolproof. In fast markets, slippage can cause stops to fill far from the intended price. Guaranteed stops are available from some brokers but come with costs. Traders should avoid using mental stops, especially when leveraged, because the emotional pressure of a losing position often overrides discipline. Position sizing, not stop placement, is the primary defense against catastrophic loss.
Leverage amplifies both gains and losses. Futures margins are typically 5–15% of notional value, meaning a small price move produces a large percentage return on margin. This cuts both ways. A 10% adverse move on a position margined at 10% wipes out the entire margin. Beginners should start with the smallest position size their broker allows and increase only after demonstrating consistent discipline over dozens of trades.
Correlation risk is another trap. Natural gas is correlated with weather-driven power prices, heating oil, and sometimes crude oil, but these relationships shift. A trader long natural gas and long heating oil may believe they are diversified, but a warm winter forecast can crush both. Similarly, natural gas equities (producers, pipelines) are correlated with the commodity but also with equity market risk appetite. True diversification requires understanding the underlying drivers, not just the ticker symbols.
Psychological Pitfalls and Behavioral Traps
Volatility triggers emotional responses that undermine even well-designed plans. Fear of missing out (FOMO) causes traders to chase spikes, often buying at the top just before a reversal. Revenge trading—doubling down after a loss to “get it back”—is a reliable path to ruin. Overconfidence after a winning streak leads to oversized positions. Anchoring to a previous price (“it was $3.50 last week, so $3.20 is cheap”) ignores changing fundamentals. Beginners should keep a trading journal, review decisions objectively, and predefine entry, exit, and stop levels before placing any order.
The 24-hour nature of natural gas futures (trading Sunday through Friday on CME Globex) means positions are exposed to overnight news, weather model updates, and geopolitical events. Traders who cannot monitor positions overnight should use stops or reduce size. The market does not wait for convenient hours. Weekend gap risk is real: a major hurricane forecast shift or a pipeline explosion can gap the market several percent at Sunday’s open, bypassing stops and causing losses beyond the intended risk.
Building a Beginner’s Framework
A practical approach for beginners starts with education and simulation. Paper trading—using a simulated account—allows practice without capital at risk. Most brokers and platforms offer demo accounts with real-time data. Beginners should paper trade through at least one full storage report cycle, one weather-driven event, and one contract roll to understand how the market behaves.
Next, choose a single instrument. Futures are direct but require larger accounts and margin knowledge. Options limit risk but require understanding of Greeks (delta, gamma, theta, vega) and implied volatility. ETFs are accessible but suffer roll decay. CFDs are flexible but carry counterparty risk. Beginners should master one instrument before diversifying.
Define a trading plan with specific rules: what conditions trigger entry, where the stop goes, where profits are taken, and how much capital is risked per trade. The plan should include a maximum daily loss limit and a maximum weekly loss limit. When limits are hit, trading stops. This rule alone prevents many blowups.
Track key data and build a routine. A daily routine might include checking overnight weather model runs, reviewing pipeline flow data, noting any LNG maintenance, and reading energy news. A weekly routine includes the storage report, the COT report, and the Baker Hughes rig count. A monthly routine includes the EIA Short-Term Energy Outlook and reviewing the trading journal for patterns.
Seasonal Patterns and Their Limits
Natural gas exhibits seasonal patterns that beginners can study. Winter demand peaks in January and February, and prices often rise in November and December as the market prices cold risk. Spring brings the “shoulder season,” when demand is low and storage builds, often pressuring prices. Summer heat drives power burn, supporting prices in July and August. Hurricane season (June through November) introduces supply risk, particularly for Gulf Coast production and LNG terminals.
However, seasonal patterns are tendencies, not guarantees. A mild winter can crush prices even in January. A hot summer with ample storage can keep prices subdued. The market prices expectations, not calendar dates. Traders who blindly buy winter contracts in October can be caught offside if forecasts turn mild. Seasonality is a starting point for analysis, not a trading system.
The Role of Geopolitics and Global Markets
Natural gas is increasingly a global commodity. Europe’s shift away from Russian pipeline gas after 2022 increased reliance on LNG, linking U.S. Henry Hub prices more closely to European TTF and Asian JKM. When European prices spike, U.S. LNG exporters maximize shipments, tightening domestic supply and supporting Henry Hub. When Asian demand surges, cargoes divert east, with similar effects. Beginners should monitor European storage levels, Russian pipeline flows (what remains of them), and Asian weather patterns, because these factors now influence U.S. prices in ways that were not true a decade ago.
Geopolitical events—sanctions, pipeline sabotage, shipping lane disruptions—can cause violent price swings. The Nord Stream pipeline explosions in September 2022 removed any residual Russian supply to Europe and sent TTF prices to record highs. While Henry Hub did not spike as dramatically, the ripple effects were significant. Traders should understand that natural gas is a strategic commodity, and political decisions can override fundamentals in the short term.
Technology, Data, and Execution
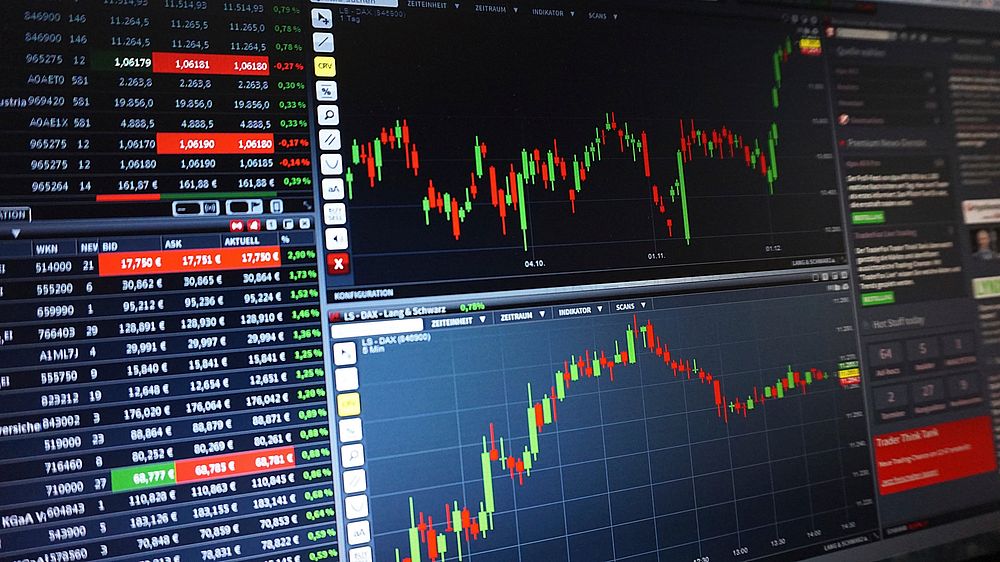
Modern trading platforms provide access to real-time prices, charting, and news. Beginners should learn to use basic technical indicators—moving averages, support and resistance, and volume—but should not rely on technicals alone in a fundamentally driven market. Natural gas respects technical levels less reliably than equities because weather and storage data can override chart patterns instantly.
Execution quality matters. During volatile periods, bid-ask spreads widen, and market orders can fill far from the quoted price. Limit orders provide price control but risk non-execution. Beginners should use limit orders when possible and avoid trading in the first few minutes after major data releases, when spreads are widest and slippage is highest.
Data subscriptions can be expensive. Free sources include EIA reports, NOAA forecasts, and CME Group’s website. Paid sources like Platts, Genscape, and Bloomberg provide faster and more granular data but cost thousands of dollars annually. Beginners should start with free data and upgrade only when their strategy requires it.
Common Mistakes and How to Avoid Them
Trading without a stop is the most common fatal mistake. Volatility ensures that a small loss can become an account-ending loss quickly. Averaging down—adding to a losing position—compounds the error. Beginners should never add to a loser; they should exit and reassess.
Overleveraging is the second major pitfall. Futures margins make it easy to control large notional value with little capital. A beginner who treats margin as buying power rather than borrowing capacity will eventually be wiped out. Position size should be based on risk tolerance, not available margin.
Ignoring the roll is a third mistake. Holding a futures position through expiry can result in physical delivery obligations or forced liquidation at unfavorable prices. ETFs that roll futures suffer decay that beginners often fail to account for. Understanding the mechanics of any instrument before trading it is essential.
Trading during low-liquidity hours—late night or during holidays—increases slippage and reduces the reliability of stops. Beginners should trade during active hours, typically the U.S. morning session when volume and liquidity are highest.
Finally, failing to adapt to changing volatility regimes is a subtle but damaging error. A strategy that works in calm summer markets may fail in volatile winter markets. Position sizing, stop distances, and instrument choice should adjust to the volatility environment. Traders who use the same size regardless of conditions will experience uneven results and occasional large losses.
Final Framework for the Beginner
Natural gas trading rewards preparation and punishes improvisation. The commodity’s volatility is structural—rooted in physics, infrastructure, and weather—and will not disappear. Beginners should respect that volatility, start small, use defined risk, and build knowledge incrementally. The market offers opportunities in every season, but only for those who understand the drivers, manage their emotions, and treat risk management as the foundation rather than an afterthought. Master the storage report, the weather models, and the position sizing math before chasing the next spike. The traders who survive are not the ones who predict every move; they are the ones who control what happens when they are wrong.

