




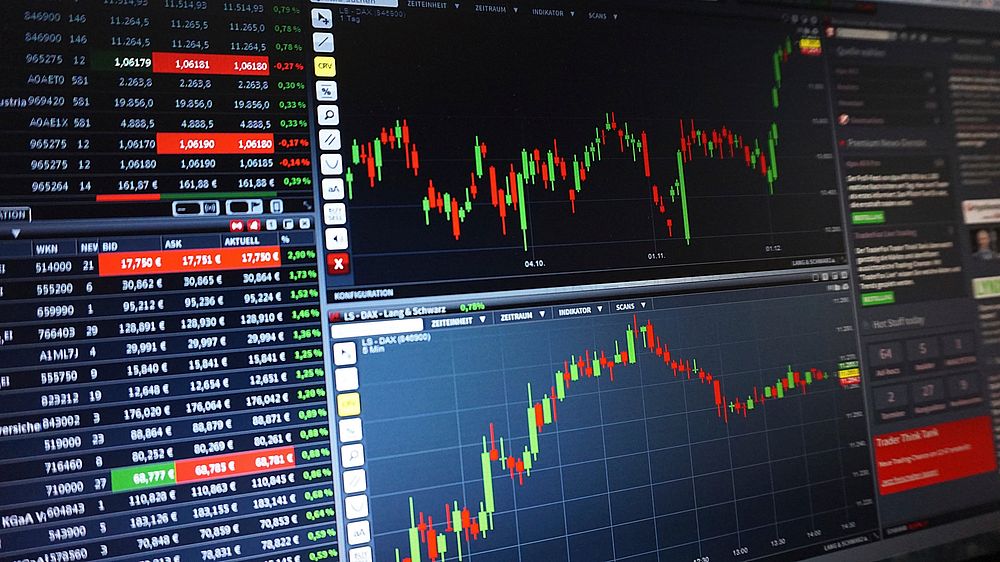

Candlestick Anatomy and Price Discovery
Every stock chart begins with a single data point, but the candlestick—originating in 18th-century Japanese rice trading—compresses four variables into one visual glyph: open, high, low, and close. A green or white body indicates the close exceeded the open (bullish session); red or black signals the opposite. The thin wicks, or shadows, mark intraday extremes. A long upper wick with a small body suggests buyers pushed price up but sellers rejected it—a rejection candle worth noting at resistance. Beginners should toggle between candlestick and simple line views on platforms like TradingView or Yahoo Finance, because line charts smooth volatility and help you see trend structure without emotional noise. Timeframe selection matters equally: a daily chart filters intraday randomness, while a weekly chart reveals institutional accumulation. Never analyze a single candle in isolation; context is everything. A doji—open and close nearly equal—means indecision, but only matters after a strong move. Volume bars beneath the price axis confirm conviction: a breakout on thin volume is a trap candidate. Set your chart to log scale when analyzing multi-year windows, since linear scale distorts percentage moves and makes historical volatility look falsely calm. Finally, adjust for splits and dividends using adjusted close data; unadjusted charts fabricate gaps that mislead pattern recognition. These fundamentals transform a squiggly line into a readable narrative of supply and demand.
Support, Resistance, and Market Structure
Support is a price zone where demand historically absorbed selling; resistance is where supply capped rallies. Draw these as zones, not hairsbreadth lines, because markets are auction processes with slippage and stop clusters. The more times a level is tested without breaking, the more significant it becomes—but also the more fragile, since resting orders deplete. Role reversal is the key concept: broken resistance often becomes new support, and vice versa. Market structure describes the sequence of swing highs and lows. An uptrend prints higher highs and higher lows; a downtrend prints lower highs and lower lows. A break of structure—price closing below the most recent higher low—is the earliest objective warning of trend exhaustion. Use closing prices, not wicks, to confirm breaks; wicks harvest stops. Trendlines connect swing points and act as diagonal support or resistance, but avoid forcing them—if you need to squint, the line is invalid. Horizontal levels trump diagonal ones because they reflect actual order flow memory. Combine structure with volume profile: high-volume nodes are magnets and battlegrounds, low-volume nodes are air pockets where price moves fast. When price approaches a major level, watch the reaction candle and volume rather than predicting the outcome. Beginners fail by trading the level itself; professionals trade the reaction to the level.
Moving Averages and Trend Quantification
Moving averages smooth price to quantify trend direction and dynamic support. The simple moving average (SMA) weights each close equally; the exponential moving average (EMA) front-loads recent data, reacting faster. The 20-period EMA suits swing trading, the 50-day SMA gauges intermediate trend, and the 200-day SMA defines the long-term regime—price above it is broadly bullish, below it broadly bearish. The slope matters more than the price tag: a flattening 200-day warns of regime change. Moving average crossovers (golden cross: 50 above 200; death cross: reverse) are lagging confirmations, not entry triggers—by the time they print, much of the move has occurred. Dynamic support works best in trending markets and fails in ranges, where price chops through averages repeatedly. Use one or two averages maximum; stacking five creates paralysis. A powerful beginner filter: only take long setups when price is above a rising 200-day SMA and the 20 EMA is above the 50 SMA. This single rule eliminates most counter-trend losses. Pair averages with price action—an EMA bounce accompanied by a bullish engulfing candle and above-average volume is meaningful; the same bounce on fading volume is suspect. Remember that averages are descriptive, not predictive; they tell you what happened, and you infer continuation probability.
Volume Analysis and Confirmation
Volume is the engine behind price and the least-faked indicator, since accumulating shares leaves footprints. The core principle: volume should expand in the direction of the trend. Rising price with rising volume confirms demand; rising price on declining volume signals weakening participation and vulnerability. Climax volume—a spike far above average—often marks exhaustion at tops or capitulation at bottoms, though the reaction over the next two to three sessions matters more than the spike itself. On breakouts, compare breakout volume to the 20-day average: roughly 1.5x or greater suggests institutional involvement. Watch for volume dry-up during pullbacks in an uptrend—declining volume on a retracement is healthy, indicating holders aren’t selling. On-Balance Volume (OBV) cumulates volume by direction and can diverge from price: if price makes a new high but OBV doesn’t, distribution may be underway. Volume profile, available on most modern platforms, shows volume traded at each price rather than each time—point of control (POC) and high-volume nodes reveal where the market agreed on value. Avoid volume analysis on thinly traded stocks, where single orders distort readings; require average daily volume above roughly 500,000 shares for reliable signals. Volume doesn’t tell you when, but it tells you who—and that’s often enough to size positions responsibly.
Momentum Oscillators and Overbought Traps
The Relative Strength Index (RSI), a 14-period oscillator scaled 0–100, measures the speed of price changes. Above 70 is conventionally overbought, below 30 oversold—but in strong trends, RSI can stay above 70 for weeks while price doubles. Beginners short overbought readings in uptrends and get run over; the correct read is that overbought in an uptrend signals strength, not imminent reversal. Use RSI for divergence: price makes a higher high while RSI makes a lower high, hinting at fading momentum—but wait for price confirmation via a structure break before acting. The MACD (Moving Average Convergence Divergence) plots the gap between 12- and 26-period EMAs plus a 9-period signal line; crossovers and histogram shifts flag momentum changes, best used in trending markets and ignored in chop. Stochastic oscillators excel in ranges, not trends. The meta-rule: oscillators are context-dependent tools—apply mean-reversion logic (buy oversold) only in range-bound regimes, and trend-continuation logic (buy pullbacks with RSI holding 40–50) in uptrends. Never trade an oscillator signal alone; conflate it with structure, volume, and a level. And remember the classic failure mode: “overbought” is a description, not an order ticket.
Chart Patterns and Statistical Realism
Classical patterns—head and shoulders, double tops, flags, triangles, cups with handles—are shorthand for supply-demand shifts, not magic. A head-and-shoulders top requires a neckline break on volume to confirm; the measured move (head-to-neckline distance projected from the break) is a target, not a promise. Flags and pennants are continuation patterns: tight consolidation on declining volume after a sharp move, resolving in the trend direction. Triangles compress volatility and resolve unpredictably—trade the breakout with volume confirmation or skip them. Base-building patterns like the cup with handle reflect accumulation and work best in leading stocks after market corrections. The honest statistics: pattern reliability is modest, roughly coin-flip to modestly favorable depending on context, market regime, and confirmation rules. Their value lies in structuring risk—defined invalidation points—not in prophecy. Beware pattern-hunting bias: humans see faces in clouds, and the same squiggles fit multiple labels. Standardize your definitions (e.g., a flag must retrace less than 50% of the pole over 3–15 sessions) and backtest them on your universe before risking capital. A pattern without volume, trend alignment, and a catalyst is decoration. Treat measured moves as probabilistic estimates; take partial profits and trail stops rather than awaiting exact targets.
Indicators, Overlays, and Avoiding Analysis Paralysis
The beginner’s greatest risk isn’t ignorance—it’s indicator obesity. Every oscillator, band, and overlay is a transformation of price and volume information you already have; stacking ten creates conflicting signals and hindsight bias. A lean, battle-tested chart template: candlesticks, volume with a 20-day average line, the 20 EMA and 50/200 SMA, RSI(14), and optionally VWAP for intraday context. Bollinger Bands (20-period, 2 standard deviations) quantify volatility and squeeze setups—a bandwidth contraction often precedes expansion—but band touches alone are not signals. VWAP anchors institutional benchmarks intraday; price above VWAP signals buyer control for the session. Average True Range (ATR) is the unsung hero: it sizes stops objectively (e.g., 1.5–2x ATR) and normalizes volatility across stocks, preventing tight-stop shakeouts. Set alerts at key levels instead of staring at screens; alerts convert analysis into disciplined patience. Clean your chart: remove redundant averages, hide gridlines, use consistent colors (green up, red down). Save templates per strategy—swing versus intraday—so you evaluate identical information every time. The goal is a repeatable decision framework, not a prettier chart. If an indicator doesn’t change your behavior in a backtest, delete it; every line must earn its pixels by improving risk-adjusted outcomes.
From Chart to Trade Plan
Reading charts is necessary but insufficient; execution discipline converts analysis into edge. A complete chart-based plan specifies: entry trigger (e.g., close above resistance with volume >1.5x average), invalidation (close below the breakout candle’s low), position size (risk 1% of account per trade; size = risk dollars ÷ stop distance), and exit logic (partial at 2R, trail remainder under rising 20 EMA). Compute reward-to-risk before entry and skip setups below roughly 2:1. Define your regime filter first—trade long breakouts only when the index is above its 200-day SMA—because most pattern failures occur in hostile tape. Journal every trade with a screenshot of the chart at entry; annotate what you saw, what you expected, and what happened. Review weekly for process errors (chasing, oversized risk, ignoring volume) rather than outcome bias. Embrace asymmetry: small losses are tuition, and a 40% win rate is profitable at 3:1 payoff. Paper trade for 30–50 setups before risking real capital; execution anxiety distorts chart reading more than any indicator ever will. Finally, respect the limits: technical analysis describes probabilities, not certainties; black swans, earnings gaps, and liquidity shocks override any pattern. Charts tell you where the market has agreed and disagreed—your job is to bet selectively when the odds and the risk align, and to survive every other day.

